 RSS Feed
The median sales price for homes in Ada County was $530,500 in August, down nearly $10,000 from July, although 32.2% higher than the same month last year.
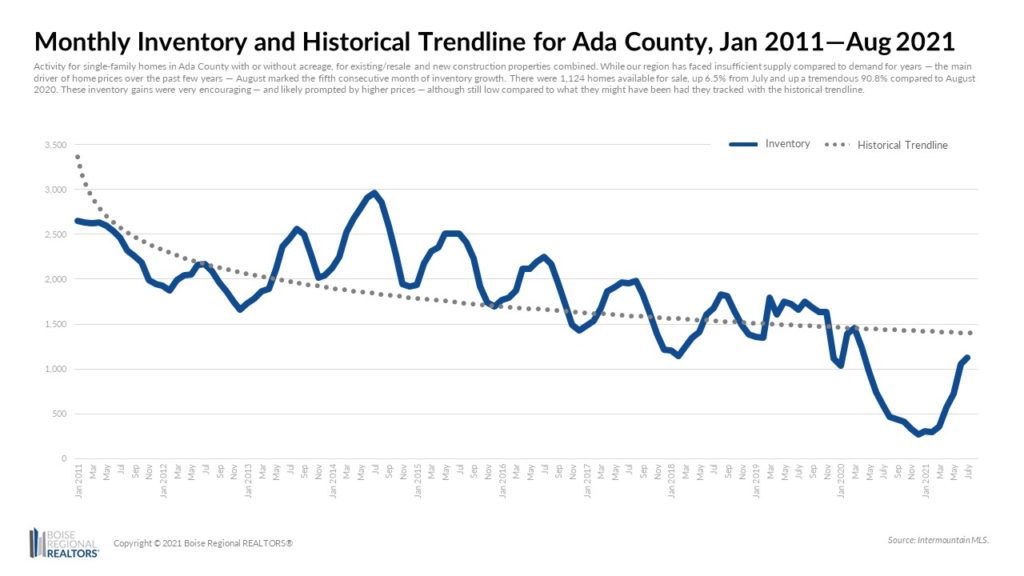
While our region has faced insufficient supply compared to demand for years — the main driver of home prices over the past few years — August marked the fifth consecutive month of inventory growth. There were 1,124 homes available for sale, up 6.5% from July and up a tremendous 90.8% compared to August 2020.
These inventory gains were very encouraging — and likely prompted by higher prices — although still low compared to what they might have been had they tracked with the historical trendline.
On the other hand, both pending and closed sales tracked with their respective trendlines. In August, there were 1,606 pending sales — homes with an accepted offer that should close within the next 30-60 days — and another 931 homes closed during the month.
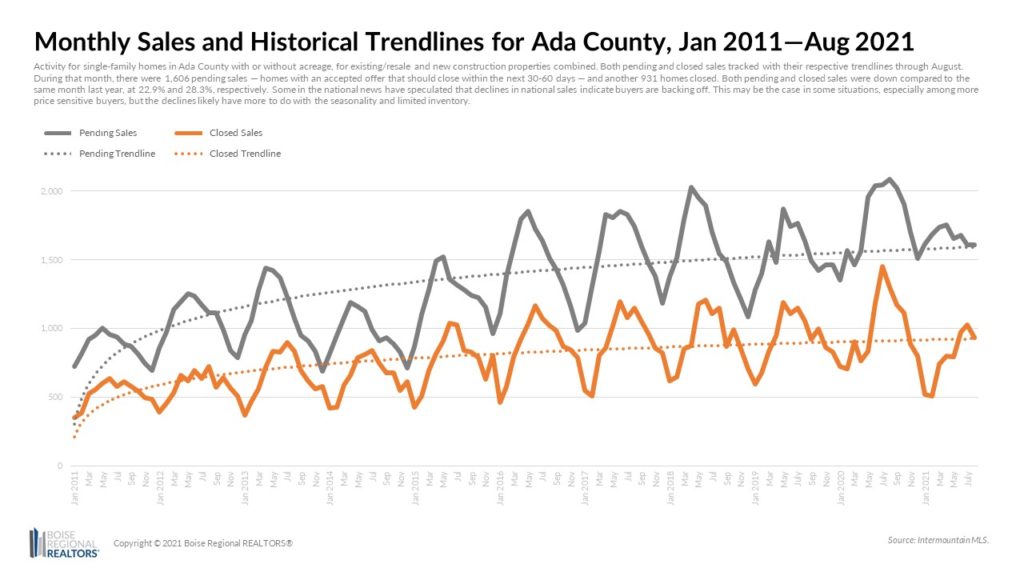
Both pending and closed sales were down compared to last year, at 22.9% and 28.3%, respectively. Some in the national news have speculated that declines in national sales activity indicates buyers are backing off. This may be the case in some situations, especially among more price-sensitive buyers, but the declines likely have more to do with the seasonality and limited inventory.
As evident in the chart above, sales activity begins to increase each December/January, typically peaking around May/June, then tapering off throughout the fall and winter as kids go back to school and the weather gets colder. The past two years haven't had that same seasonal feel with the pandemic compressing the traditional market cycles, but any additional declines in activity from now through the end of the year are not completely atypical.
Note on Historical Trendlines: These are helpful tools but should be used in conjunction with other metrics to understand why something may be trending higher or lower than past data might otherwise suggest. To that point, we released a blog post about a recent Florida Atlantic University study suggesting Boise metro homes were overpriced compared to historical trends, which you can read here. You can also check out our mid-year housing summit presentation for insights as to why inventory levels continue to be constrained despite ongoing demand.
The uptick in the number of homes for sale continues to be good news for buyers, but buyers must still be prepared to act quickly once they've found a home to purchase. We advise buyers to work with a REALTOR® and lender to determine ways to make an offer as competitive as possible.
One of the most popular ways buyers have competed is on price, offering to pay more than the listing price. Of the homes that closed in August, 42.3% sold for more than list price, paying on average, $22,675 more than list, which is a change from the past few months when a majority of homes were selling over list price.
For homes that sold under their original list price in August, buyers paid $24,423 less, on average. That said, decisions on what price to list a home at, or whether a buyer might offer more or less, can be made easier with the help of a REALTOR®.